
The performance of Indian States and Union Territories on Global Nutrition Targets: A rank-based analysis using a composite nutrition index
DOI:
https://doi.org/10.26596/wn.202314416-25Keywords:
Nutrition Index, Composite Index, Nutrition Scoring, RankingAbstract
Background
The increased global discourse on nutrition challenges has underscored the imperative to comprehend and monitor diverse manifestations of malnutrition. The comprehensive monitoring of various forms of malnutrition, including undernutrition, overnutrition, and micronutrient deficiencies, plays a pivotal role in assessing the progress towards the Global Nutrition Targets (GNTs) established by the World Health Assembly (WHA), as well as nutrition-related SDGs (SDGs). To this end, a Composite Index (CI) of six nutrition indicators centred on GNTs has been formulated to gauge and appraise progress across India’s various States and Union Territories (UTs).
Methods
To calculate the CI, the authors apply a methodology developed by Webb et al. (2015). Disparities in performance between Indian States and UTs are highlighted. The analysis uses data from two surveys: the National Family Health Survey (NFHS) of 2015-16 and the NFHS of 2019-21. The main analytical tool is a rank-order analysis of the CI scores among states and union territories, with higher scores representing greater progress in achieving the targets for the six indicators.
Results
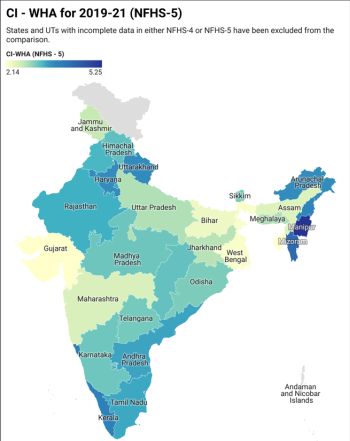
Based on data from both NFHS-4 and NFHS-5, India’s overall estimated CI-WHA score stood at 2.80 and 2.86, respectively. Notably, the CI-WHA exhibited considerable inter-State/UT variation, ranging from 2.16 in Dadra and Nagar Haveli and Daman and Diu to 5.07 in Manipur, as per NFHS-4, and from 2.14 in Gujarat to 5.25 in Manipur, as per NFHS-5. Among the 34 States/UTs for which complete data sets for all six WHA targets were available from NFHS-4, the top five performers according to the developed CI-WHA targets were Manipur (5.07), Mizoram (4.87), Nagaland (4.12), Kerala (4.00), and Telangana (3.80). In contrast, the bottom five States/UTs based on NFHS-4 data were Dadra and Nagar Haveli and Daman and Diu (2.16), Uttar Pradesh (2.31), Meghalaya (2.40), Haryana (2.40) and Madhya Pradesh (2.43). However, based on NFHS-5 data, the top five States/UTs were Manipur (5.25), Mizoram (4.29), Puducherry (UT) (4.15), Goa (3.89), and Kerala (3.87), while the bottom five were Gujarat (2.14), Tripura (2.16), West Bengal (2.20), Bihar (2.31), and Assam (2.46).
Conclusions
Applying the CI to monitor States/UTs’ progress in reaching WHA targets. Furthermore, it offers a means to track the progress made on nutrition-related SDGs at the sub-national level. This can help identify States/UTs whose nutrition policies and programs require targeted enhancements to comprehensively improve India’s performance concerning GNTs. It aims to empower policymakers with the information required to make informed decisions and implement effective measures to enhance overall nutrition outcomes, especially in under-performing States/UTs.
Downloads
Downloads
Published
Issue
Section
License
Authors retain all copyrights. In making a submission to World Nutrition, they are certifying that all material is theirs except quotations, as indicated, and that they have obtained permission for any photos, tables, or graphics taken from other publications or websites.
How to Cite
Share